Wednesday, 11 April 2012

Setting Up Shop

Why project managing business intelligence implementations is different

Consider yourself as managing the construction of a building - you need to design, build and furnish it. Now let’s say that building as an IT system.
Where ERP could be an office building – once built and furnished its ready to go – BI is more like a shop. It needs stock and then continual re-stocking.

So the initial system implementation for both is based on a similar waterfall-type approach:
ERP and other business process systems tend to have an inherent set of business processes they enable. A BI system, on the other hand, can encompass any number of business processes – just add data sources and business objects.`

A bit like the departments of your shop – you can open new departments as fit consumer tastes.

You also need to think about the stock within those departments, keeping that relevant. Likewise a BI system needs to ensure it business objects stay relevant to the evolving organisation.

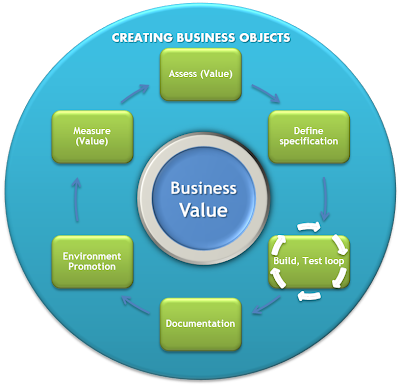
So once live, a BI system is cyclical. This means that during the system implementation the processes you set up to manage this constant change are as important, if not more so, than the initial business objects which are delivered.

This process will be used and stress-tested during the initial implementation for the initial ‘stock up’, and then used repeatedly post go-live
So whether your shop is a supermarket (enterprise-wide BI system) or corner shop users visit your shop to choose the business objects they want.

Some of your stock goes out of fashion and sits on the shelves, eventually needing disposal. In the same vein BI content becomes unused and a well-managed BI system has processes to manage its update or disposal, keeping the system appealing and meaningful to users.

Project management should set up not just the platform but the processes to mean success for the future


  • Acceptance criteria needs to cover both

  • Processes are more important than the content

  • Technology – auditing and impact analysis – can support the processes but is only useful if processes are in place to harness it

Wednesday, 4 April 2012

Data Replication - It's Not My Area of Expertise!

Can you give me an idea for a blog about data replication? Sorry mate that’s not my area of expertise! Great thanks, actually yeah great, that’s a really good point. Who really deep down, if you had a choice would want their area of expertise be data replication? 

Apart from potentially insulting a global community of IT professionals I think I’ve just insulted myself! But honestly how many high schoolers dreamt of analysing data replication logs and the Change data capture routine of a heterogeneous database environment? I would guess not many. And I think that is the point. Most requirements from a business level are straightforward I need data to go from point A, to point B and maybe back again. Sure there are often manipulation needed on the way however really do you want to be spending your whole day on this one?

Whether it's meeting a requirement for Big data, business analytics, or an online application supporting huge numbers of users many businesses will have considered using an off the shelf CDC or data replication software package.

Now I appreciate someone somewhere has a tough job working things out in terms of the routines needed for a resilient data replication process. But once you’ve done the math then what do you want? I say it’s a CDC/ data replication software package that can be easily implemented to manage this process you’ve spilt blood, sweat and tears formulating. Do you want to spend hours having to learn effectively a new language? Do you want to pay someone else to come and teach you how to learn this new language?   

If this rings true for you and you want to an intuitive CDC/ data replication software package then I use DBMoto and data replication isn’t my area of expertise!
Writted by Ben Hedger, Senior Sales Consultant, DSCallards 

Thursday, 22 March 2012

It's a Changing World Out There - Business Intelligence in Retail


Shopping habits are rapidly changing.  There's a massive shift from the high street to online shopping so now is the time for the retailers to really get their finger on the pulse of their business.

As a Business Intelligence Consultant, I’m talking to customers from every conceivable part of industry but more than ever I’m amazed as to the number of retail organisations that I speak to that still don’t have any formal reporting tools in place.

BI in Retail should be able to deliver the ability to access information affecting the entire retail business, often as the data is created,  but recent statistics back up the conversations I’m having with the retail sector  in that only :

50% of retail businesses have formal BI solutions in place, 70% of SMB Retail still use spread sheets as their primary source of analytics over more functional BI tools , such as SAP Crystal Reports, and amazingly nearly 25% of the retail shops on your high street today are still using spread sheets as their only analytical tool! *

Retailers need to use BI in order to predict shopping behaviour and good BI should be able to deliver this information and be able to measure its impact directly to management, store staff and regional staff alike,  at the right time in order to be able to maximise sales. 

By including customer product and performance data in their BI program every retailer can learn who their customers are, what they want today, tomorrow and in a month's time. Improving data access to customer facing staff should be a key strategy for every retailer and this is impossible with manual speadsheets.

Slow and inaccurate BI will lead to out of stock scenarios, customer satisfaction issues, promotional delays and lost sales opportunities.

Good BI in retail impacts on the seasonal swing nature of the business by offering accurate and well planned marketing plans that everyone knows about, well timed store events and correct staffing levels.

Larger retailers who have embraced BI are outstripping smaller vendors as they are able to predict purchasing behaviour, but with SAP Crystal Solutions entry level BI Essentials package it doesn’t have to be BI only for the “Big Guys”.

Written by:  Sue Mitchell, DSCallards Ltd


*Source:   The Opportunity for Business Intelligence Enhancements in Retail - October 2011- Aberdeen Group

Wednesday, 21 March 2012

Top Ten Dashboard DON'Ts!


1. Use flashy visuals and chart types when simple alternatives are capable of conveying the same message. Meaning must be derived from dashboards quickly. If charts or graphs are overly garish or complex, interpretation is hindered and usage rates will decline. When considering data visualisations for your dashboards, ensure that you: 

  •  Reduce the data to ink ratio: Follow the advice of Edward Tufte in his renowned The Visual Display of Quantitative Information: Remove anything that isn’t absolutely central to the interpretation of the data. Only display objects that are vital to the accurate interpretation and contextual understanding of the underlying data – avoid all design aspects that are unconnected to the task of analytic communication.
  • Use color sparingly for maximum contrast to highlight important data
  • Make your data standout from chart and dashboard background
  • Use gradients and gridlines carefully
2.   Think that a dashboard is final: Reporting needs constantly change and dashboards have to change in accordance, to ensure the right metrics are being reported on and displayed in the most appropriate manner, to support current business strategy. To accommodate the inevitability of changing business needs, adopt an iterative approach to dashboard design. 

3.   Select visualisations to represent metrics without considering the values themselves: Different types of graphs highlight different types of data, and features within a data set, in distinctive ways. Carefully consider the information and message that each chart is attempting to derive from your chosen metrics and values.

4.   Measure metrics that are not linked to specific business objectives: The worth of even the most engaging dashboard will be severely diminished if it reports on metrics unrelated to core business objectives. 
 
5.  Forget to secure agreement on dashboard KPIs and their definition: Reaching consensus on the most crucial metrics and benchmarks will allow you to produce understandable, actionable and uniform KPI reports. Additionally, don’t assume that if everyone agrees on the same KPIs that they also agree on how they should be measured. 

6.  Use/display obscure metrics: Even if agreement is reached amongst user groups regarding dashboard KPIs and metrics, ensure that the most straightforward metrics are used to monitor progression towards business goals. If users are unable to decipher the significance of a report with a momentary look, its usefulness and purpose is moot. 

7.  Deliver reports underpinned by poor data: Once management and various business groups have reached consensus on the metrics that each departmental, strategic or operational dashboard should measure and monitor, ensure you are collecting the data needed to compile the necessary reports. Incomplete or poor quality data will lead to inaccurate dashboards and distrust amongst business users, who will proceed to search elsewhere for their answers, rendering your dashboards redundant.

8.  Design a dashboard that is complicated and cannot fit on a single screen: The KPIs and values displayed on a BI dashboard are meant to be able to be consumed quickly for understanding-at-a-glance. Whilst users may choose to drill into a particular chart for extra detail, they should be able to gain a high level overview quickly and effortlessly. 

9.   Include too many alert scenarios: It’s like the boy who cried wolf. If people are regularly ‘alerted’ to events that most often require no action, eventually, people will stop paying them attention. 

10.   Include no alert scenarios: If users are not notified of action that needs to be taken as a result of a report, what’s the point of the report? As stated before, reports need to be goal oriented. Users need to be alerted to events that diverge from projections and desired objectives, or when a predefined benchmark is reached. 

For more information visit:  www.crystalreports.co.uk 
 

Tuesday, 13 March 2012

How To Install Yellowfin

We will be working as root. If you are not you will need to sudo the majority of these commands.  A pre-requisite is to have downloaded the Yellowfin Evaluation - click here.  Ensure that the software is saved at a location, which your new Yellowfin server can access.

Please contact us at sales@dscallards.com if you have any questions.

Install Java

Edit the /etc/apt/sources.list to include a new repository.
nano /etc/apt/sources.list

Add the new repository to the end of the file
.Update apt.


apt-get update

Download and install the latest version of Java.

apt-get install sun-java6-jdk
Install and Configure MySQL

Download and install the latest version of MySQL.
apt-get install mysql-server
 When prompted, specify a root password.

Create the yellowfin database.


mysql -u root -p
Enter the root password. From the mysql prompt.


CREATE DATABASE yellowfin;
 
Grant all permissions on the yellowfin database to the new yellowfin user.
GRANT ALL PRIVILEGES ON yellowfin.* TO 'yellowfin'@'localhost';

Exit out of mysql.
mysql> quit
Install Yellowfin
Download the latest version of yellowfin and transfer it to your server along with your licence file if you have one. In my instance, I used wget to download the latest install package and licence file from a network server.
From the directory that contains the yellowfin.jar file, kick off the installation wizard.
  1. Specify an installation directory. For example, /etc/yellowfin.
  2. Enter the path to your licence file or leave blank to upload later from the admin console.
  3. Specify the port you want yellowfin to listen on. For example: 3456.
  4. Select option 6 (MySQL) from the database type list.
  5. Choose NOT to create a new database or user.
  6. Enter localhost for the database server host. Leave the port as default.
  7. Specify the name of the database we created earlier, for example: yellowfin.
  8. Specify the username and password for the user with permissions to alter the database, in this case the user we created earlier: yellowfin.
  9. Choose whether to install the tutorial database, reports and different languages.
  10. The install process will begin.
  11. With the installation complete, start yellowfin.
/etc/yellowfin/appserver/bin/startup.sh

Using a browser, browse to the front end of Yellowfin. http://yourserver:port. You can then log in using the default username and password, which you will receive once you have registered for an evaluation.

For more information:


Written by Tom Williams, Head of Infrastructure, DSCallards  

Call us on 0800 652 4050, visit www.yellowfinbi.co.uk or email us at sales@dscallards.com.

Wednesday, 29 February 2012

Data Replication? Who Cares ...?


I don’t expect data replication will be on the top of many business agendas. I don't have any research statistic to back that up however I don’t recall ever seeing it on one the lists that get published telling us what’s on the agendas of the IT manager, CTO, CIO or whoever.  In my experience growing businesses in particular tend to use many different independent applications to manage their operations it is an afterthought. It’s only considered once the business realises there’s an issue.

The issue might be that data from one application wasn’t in line with data in another. This might sound small but the impact could ripple. For instance imagine the customer details in a financial system were not the same as those in the online CRM application. The impact is a frustrated customer as the invoices goes out with a misspelling of their name as when the customer called in to notify you of the change it was only updated by a customer facing employee who only had access to the CRM system. What would happen if it were the address, do you think you’re going to get paid on time?

Another might be with using legacy systems, which were meant to have died out with the dinosaurs but in reality are still the cornerstone of many businesses IT infrastructure, reliably storing and serving up data. The requirement for data replication comes when the data is not getting returned quick enough or the frequency at which its being requested impacts the performance of the application the legacy system supports. Recently a client told us that users were binning a recent IT project of implementing a companywide Intranet application saying it was too slow. The issue related to the response times of the AS400 as this was where much of the data in the intranet solution was stored. In order to improve the performance the data required was replicated into a dedicated MS SQL database, issue solved.

Making sure your data is synchronised between applications is always going to be an issue. Perhaps the one that we are seeing more than most is the need to replicate data out of multiple database types for business reporting. Many businesses do this by accessing the data directly against the individual databases however more and more are using staging databases, data warehouses to bring business critical data into one place. This could be due to one of the issues mentioned above, it could be due to the inevitably growth in data. As data storage becomes even cheaper and usable data coming from more sources specifically online data there should be a realisation. If more data can be captured then more data will be captured! Business Intelligence, which is quite a hot topic on many organisations agenda according to the majority of research that’s published conforms to the belief that success is in the detail. Understanding data helps support the decisions a business makes to shape its future.

In these instances finding a tool that can reliably connect the dots of heterogeneous data sources is golden.

The right tool can have a positive impact, it can reduced the number of man hours spent on a process that has been used for years. It can improve reliability and relieve frustration by reducing the operational risks in all manner of ways. There is a ripple effect and it starts with the data.

Related Articles of interest:

Written by:  Ben Hedger, Senior Sales Consultant 

Wednesday, 8 February 2012

Repairing a Broken SAP BusinessObjects Edge System

Back in the days of Crystal Enterprise 10 and earlier it was quite commonplace to install a copy of Crystal Reports 10 on the Crystal Enterprise 10 server. This was done to assist in checking database connectivity and was used purely as a troubleshooting mechanism to resolve any connectivity issues.

Nowadays installing Crystal Reports 2008 on an SAP Crystal Reports Server 2008 machine or SAP Business Objects Edge XI 3.1 machine can be a much riskier business. A perilous journey, fraught with unsuspecting error messages like the one below.


Here is my account of what happened when I installed SAP Crystal Reports 2008 V1 Service Pack 3 onto an SAP Business Objects Edge XI 3.1 Service Pack 1 machine. It is a harrowing tale. Searching the internet, I came across many poor souls who had done the same thing as me and the one message that came from these forum postings was; - that the problem was solved by performing a re-installation. There were other potential solutions on these forums that I will mention later.

Let’s set the scene. Crystal Reports installed without error or indeed any warning message that it had detected another SAP Business Objects application on the same machine. All the published reports had been failing to connect to an Oracle database over a WAN, so in order to get a more verbose error message, Crystal Reports was installed for troubleshooting the database connectivity problems.
Soon after the installation, things started to go wrong. No-one could log in to Business Objects Edge. The services in the SIA were either at a ‘Failed’ or ‘Stopped’ status. No Client SAP Business Objects application would open. The image above appeared. This looked like a serious problem. The Business Objects Edge Server was re-started and the services took a long time to start, but they did start eventually.
But now, there were different errors to consider. I tried opening the Designer client application. This worked and I was able to import a universe, but as soon as I tested the Universe Connection an error appeare.

I tried importing a different universe and got a similar message in the image below.

I then took a bit of time to consider exactly what was working and what was not working. I could log in to InfoView and I could run and schedule Crystal Reports without any problem. I then decided to record every error message I could find by attempting to open all of the client design tools.


Desktop Intelligence wouldn’t allow me to generate a query.


Xcelsius failed when it tried to access external data.


Query as a Web Service would allow me to edit a query, but not to execute it.


Even Web Intelligence wouldn’t schedule, but strangely, you could view a Web Intelligence report on demand.


A pattern was developing from each of the error messages shown in the images, with the exception of the Web Intelligence image.

On searching the internet, typing the entire contents of the errors, brought about two potential solutions. The first was to place the Oracle Home folder into the PATH Environment Variable. I checked this and it was already in place. The second was to place the full path to the ConnectionServer folder shown in the error message images into the PATH Environment variable. I tried this and it made no difference.

Now it was time to think of other potential solutions. The first was to perform a brand new installation onto a new server and then migrate the contents of the source system to the new destination system using the Import Wizard. But there was no other server available. A complete restore of the server from a backup was possible, but deemed too much of a risk, as the server had other business critical applications running on it.
The only way forward was to manually repair the system somehow. I looked in the ConnectionServer folder and examined the .dll files. As soon as I did this I could see a potential way of solving the problem. By lloking at the version numbers of the .dll files, I could see that some were version 12.1 and others were 12.3. This confirmed that the installation of Crystal Reports 2008 V1 SP3 had overwritten key .dll files and now it might be possible to copy back the 12.1 versions from the backup to effectively put the system back to its original state.

But wait a minute. .dll file have dependencies, don’t they? And don’t they need registering using Regsvr32.exe? More searching of the internet was required. 

I decided to perform a test on one of the .dll files. I copied the 12.1 version back to its original location and then tried to register it. The message below appeared.


More searching of the internet led me to an application called Dependency Walker. Located at http://www.dependencywalker.com/.  This application allows you to locate a file and then see all of the dependent .dll files it requires to perform correctly. I used this for each of the .dll files in the error message images and manually, one by one, copied each required 12.1 .dll file back to its original location.
This had been a last resort. I had no further ideas or potential solutions I could think of, other than obtaining a server and performing the migration as mentioned earlier.

I restarted the servers from the SIA and hoped for the best. An image of Dependency Walker is shown below:


 After all the services had re-started and were running and enabled I tried opening each of the client applications, and this time they all worked as normal.The only exception was Web Intelligence scheduling. But after searching the internet again by inserting the entire error message into Google, I completely stopped and then started the Adaptive Job and Processing servers and this resolved the problem.

This manual fix took the best part of a day. If you intend to install multiple SAP Business Objects applications on the same machine, be it a server or even a client machine with SAP Desktop applications like Crystal Reports and Live Office, you must first check what you have installed already and note down the build number. This will be found in the ‘Help->About’ section. Typically this number will look similar to 12.3.0.601. For SAP Crystal Reports 2008 V1, SAP Crystal Reports Server 2008 V1 and SAP Business Objects Edge XI 3.1 applications the first number (12) denotes the build and the second (3) denotes the service pack currently installed. In order for the applications to work alongside each other you must ensure that each application is at the same service pack level.  If possible, test this on a pre-production or development machine before rolling out to a live production environment.

Written by Steve Chapman, Senior Business Intelligence Consultant, DSCallards
For more information visit:  www.crystalreports.co.uk